¡Esta es una revisión vieja del documento!
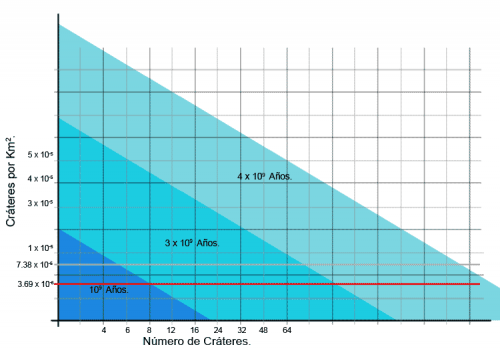
Grafic of the age of the surface of the Moon.
The following grafic show us the ages of the surfaces of the Moon that we study:

How do we read this grafic?
In the axis X we put the diameter of the craters, in the axis Y we put the number of the craters in one  acoording the their diameter. With these dates, in the grafic we obtein a interval inside of a zone, and this zone is the age that we went.
How do we interpret this grafic?
This grafic show that we studied: a surface of the Moon with many craters and diameters of the craters big is older (always we compare with a other surface).
If we have  craters in one
  with a diameter between 4 and 8 Km, this surface will be old, but will be younger that a surface with
  craters in one
  with a diameters between 4 and 8 Km.


